

Now that we have passed the midpoint of 2019, it seemed like a good time to take a look at how the FDA and industry are doing at getting biotechnology product applications approved, and put this into historical perspective.
Between 1965 and the end of Federal Fiscal Year 2013, the FDA had approved approximately 86 therapeutic biopharmaceutical products (TBPs). Early on, the rate of approvals was glacially slow with only four (4) BLAs approved for TBPs in the first 22 years (see Figure 1). However, with the advent of recombinant DNA technology in the 1980s, the number of product application submissions increased, and the number of approvals went up modestly to an average of about three (3) approvals per year, over the next 20 years (1988 – 2008). Between 2009 and 2013, the average approval rate increased to around six (6) approvals per year. Then, in 2014, the number of biotech approvals began to skyrocket, and has been growing exponentially ever since. This rapid increase in the approval rate may be due to the expedited review initiatives that the FDA implemented after passage of the 2012 FDA Safety and Innovation Act. Today, there are approximately 178 FDA-approved biotechnology products being regulated by the Center for Drug Evaluation and Research (CDER).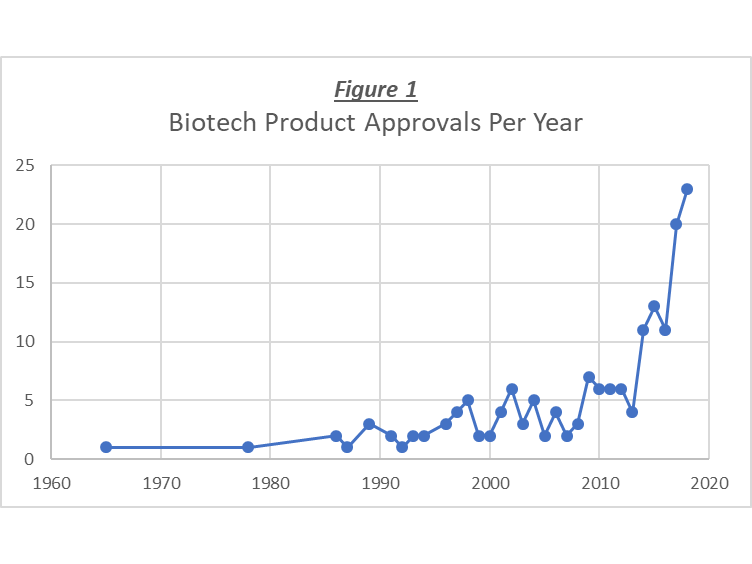 In conjunction with this substantial increase in the number of approvals per year, there has been a shift in the types of products approved (see Figure 2). Until about 2014, the number of non-Mab (monoclonal antibody) products approved per year was, on average, greater than that of the Mab products (i.e., 2.0 vs. 1.3). Then, starting in 2014, the number of Mab approvals per year went from ~6 to ~16, while annual approval rate for non-Mab product was nearly unchanged. Note that in Figure 2, the data for 2019 is only for half of the year, so the bar could be twice as high (more or less) by the end of the year. Today, there are just over 100 therapeutic Mab products approved, and approximately 76 approved non-Mab growth and differentiation factors, cytokines, and enzymes.
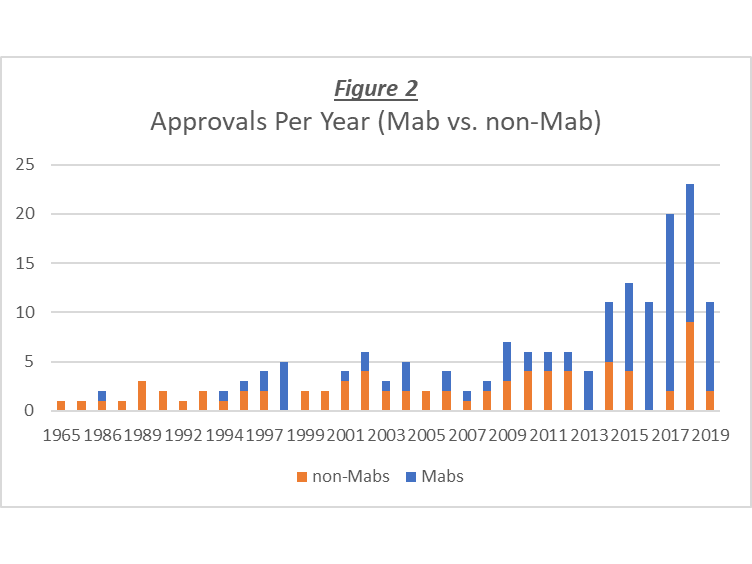 How has the approval of biosimilar products impacted these numbers?
Figure 3 shows the data for all Mab and non-Mab biosimilar product approvals, and it can be seen that the annual number of approvals for Mab biosimilars is generally higher than that of the non-Mab biosimilars, and that for three of the five years, there were no approvals of non-Mab biosimilars. Overall, there have been 16 Mab biosimilars approved vs. 5 non-Mab biosimilars. So, taking the biosimilar approvals into account brings the total number of Mab and non-Mab products closer, however, it does not account for the differential numbers of approved products or the significant increase in the approval rate for Mab therapeutics.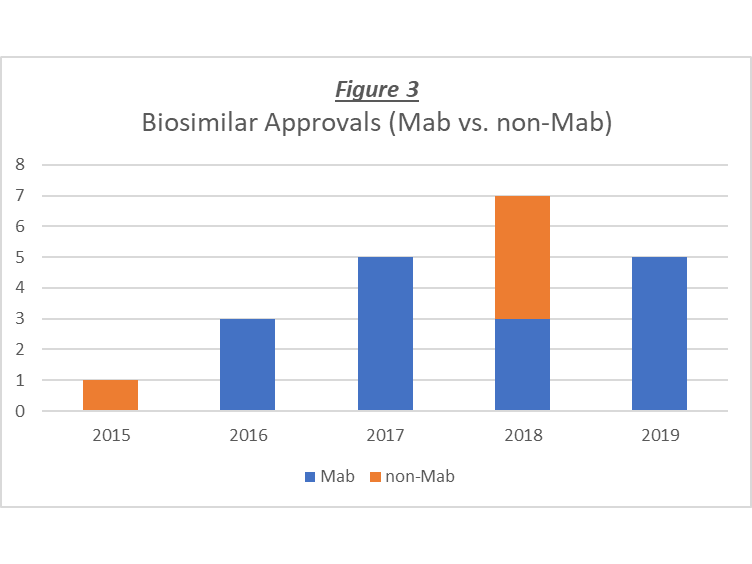 In any event, the undisputable increase in the rate of approval of new therapeutic biotechnology products that has occurred over the last few years is excellent news for the patients in need of these medicines, as well as the industry that works hard to develop them and bring them to market.