


This morning, the FDA updated its Generic Drugs Program Monthly and Quarterly Activities Dashboard (here) to provide industry with the 4th quarter ANDA mean and median approval times for ANDA approvals and Tentative approvals.
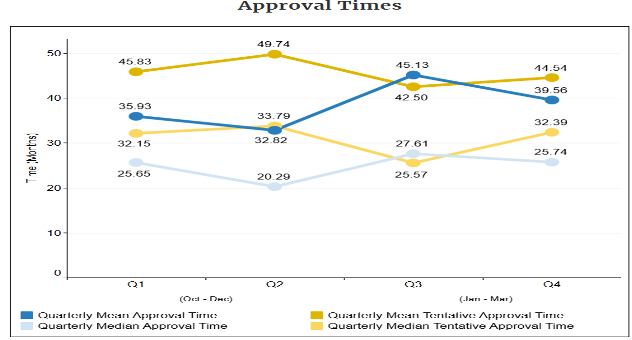
The chart shows ups and downs from quarter to quarter however the mean and median approval time graphs for approvals and tentative approvals both track in their similarity. Median approval times were all in the 20s while mean approval times were significantly higher, mostly in the upper 30-month range with one outlier at 45.13 months. Mean approval times are influenced more by the inclusion of various cohort years of applications being approved. The mean approval times, which are lower, are influenced more by the inclusion of first cycle approvals that keeps the numbers down.
Figuring out tentative approval times is a real crap shoot given factors such as patent and exclusivity protection, 30-month clocks, lawsuits, and settlements among other things. I am not sure what you can really take out of the tentative approval times other than they show that there are a different set of factors that impact approval times.