

Every day, when I look at the ANDA approvals list, I see that most of the approvals are for the older ANDAs that were submitted to OGD before Year 4 of GDUFA I (when goal dates started). Some of these applications are anywhere from six to ten years old. Once they receive approval, they have a “negative trend” on the mean and median time to approval reported by the FDA. That is, they tend to make those figures seem worse than they otherwise are.
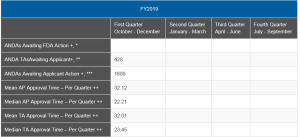
How can we know how the Agency is doing on GDUFA II applications? Well, that would be simply to report mean and median approval times by cohort year. However, that is a data set we have not seen from the FDA. I will note, however, that the mean and median approval times appear to be getting somewhat better in the most recently released quarterly figures (end of January). Last year’s numbers, reported by quarter, show the change (see below).
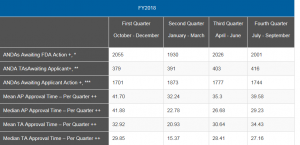
You can see that the up and down in the numbers reported by quarter for FY 2018 are likely due in some quarters to more first- or second-cycle ANDA approvals that impacted the mean and median. The bounce is quite substantial, but the numbers appear, for the most part, to be stabilizing. As the popular refrain from an old song goes, “Ain’t no mountain high enough,” the numbers will get better when the mountain of old ANDAs is finally totally through the system. In the case of ANDAs anyway, oldies are not always goodies.