

The Chart below was posted late yesterday on the CDER webpage. The most notable figures are the mean and median approval times and the significant reductions over those of the first quarter of FY 2018. This appears to indicate that either approval times were much shorter in the second quarter or the number of old ANDAs approved was significant less. My guess it was some of each that contributed to the decrease. Quarters 3 and 4 will be telling in this analysis.
GDUFA II Quarterly Performance Report
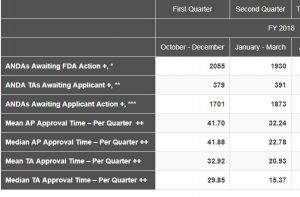
In discussing the data the FDA notes: Numbers reflect current data at the time of posting and may change based on refreshed counts in our tracking systems. These numbers are not intended for Congressional reporting purposes. Additional metrics are available in the monthly activities report of the generic drugs program. The FDA posting and the description of the terms can be found here.